28 feb 2025
Every trader wants to identify high-probability trading setups, but not everyone knows how to do it effectively. Many traders rely too heavily on indicators without understanding their purpose, attempt to predict market reversals instead of following trends, or fail to implement proper risk management strategies.
If you're making these mistakes, you may struggle to find high-probability trading opportunities. But don't worry - this guide will walk you through everything you need to know about price action analysis and how to identify high-probability trading zones with confidence.
What You Will Learn
- Why trading with the trend increases returns and reduces risk.
- How to identify key trading zones on a price chart.
- How to use pullbacks, breakouts, and failure test patterns for entries.
- How to set appropriate stop losses to minimize risk.
- A simple high-probability trading strategy you can implement immediately.
Why Trading with the Trend Improves Your Success Rate
One of the most effective ways to increase your chances of success in high-probability trading is to trade with the trend. Many traders, especially beginners, make the mistake of trying to predict market reversals, assuming that they can catch the exact moment when a trend shifts. However, trends exist for a reason - market forces such as supply and demand, institutional trading, and overall economic conditions create momentum that drives prices in a specific direction over time.
By understanding and following these trends, traders can position themselves to take advantage of high-probability trading setups instead of working against the market’s natural flow.
Understanding Market Trends
Trends are categorized based on price movements and market structure:
- Uptrend: The market forms higher highs and higher lows, indicating that buyers are in control.
- Downtrend: The market forms lower highs and lower lows, showing that sellers have the upper hand.
Rather than attempting to anticipate where a trend will reverse, traders should focus on identifying the overall direction of the market and aligning their trades accordingly. This approach significantly increases the probability of success because trends tend to persist over time rather than change abruptly.
Why Trading with the Trend Works
1. Higher Probability of Winning Trades
The strongest price movements tend to occur in the direction of the trend. If a market is trending upward, most price retracements will be short-lived before the trend resumes. Likewise, in a downtrend, price rallies often fail as selling pressure continues. By trading in the direction of the trend, traders improve their odds of capturing profitable moves while reducing the risk of getting stopped out by sudden counter-trend movements.
2. More Reliable Entry and Exit Points
Trading with the trend allows traders to enter at more favorable price levels, such as during pullbacks or when the price breaks out of consolidation. Since trends are often supported by institutional buying or selling, these setups are more likely to work in favor of the trader compared to random trades taken against the market’s direction.
3. Minimizing Risk with Trend-Following Strategies
When traders go against the trend, they are essentially betting that the market will reverse—a strategy that comes with higher risk. If a trader enters a short position in an uptrend or a long position in a downtrend, they are fighting the momentum that is already established in the market. This can lead to frustrating losses and missed opportunities. By following the trend, traders reduce unnecessary risks and trade in the direction where the odds are in their favor.
4. Market Psychology Supports Trend Trading
Trends develop because of the collective behavior of market participants. When traders and institutions notice a strong trend, they often enter trades in the same direction, reinforcing the price movement. This behavior creates self-sustaining trends, making trend-following strategies even more effective. Going against the trend means fighting this collective momentum, which can lead to losses if the trend continues despite short-term fluctuations.
Identifying a Trend for High-Probability Trading
To effectively trade with the trend, traders must first confirm that a trend exists. There are several ways to do this:
- Moving Averages: A market trading above a rising moving average (such as the 50-day or 200-day moving average) is generally in an uptrend, while a market trading below a falling moving average is in a downtrend.
- Trendlines: Drawing trendlines connecting higher lows in an uptrend or lower highs in a downtrend can help visually confirm the trend.
- Price Action Analysis: Observing whether the market is consistently making higher highs and higher lows (uptrend) or lower highs and lower lows (downtrend) is a simple yet effective way to determine the trend direction.
Applying Trend Trading in Real Market Conditions
Rather than guessing when a trend will reverse, traders should focus on high-probability trading setups that align with the existing market trend. This could include:
- Buying pullbacks in an uptrend: Entering long positions when price retraces to a key support level before continuing higher.
- Selling rallies in a downtrend: Entering short positions when price bounces up to a resistance level before falling again.
- Trading breakouts in the direction of the trend: Entering trades when the price breaks past a significant level of support or resistance, confirming the continuation of the trend.
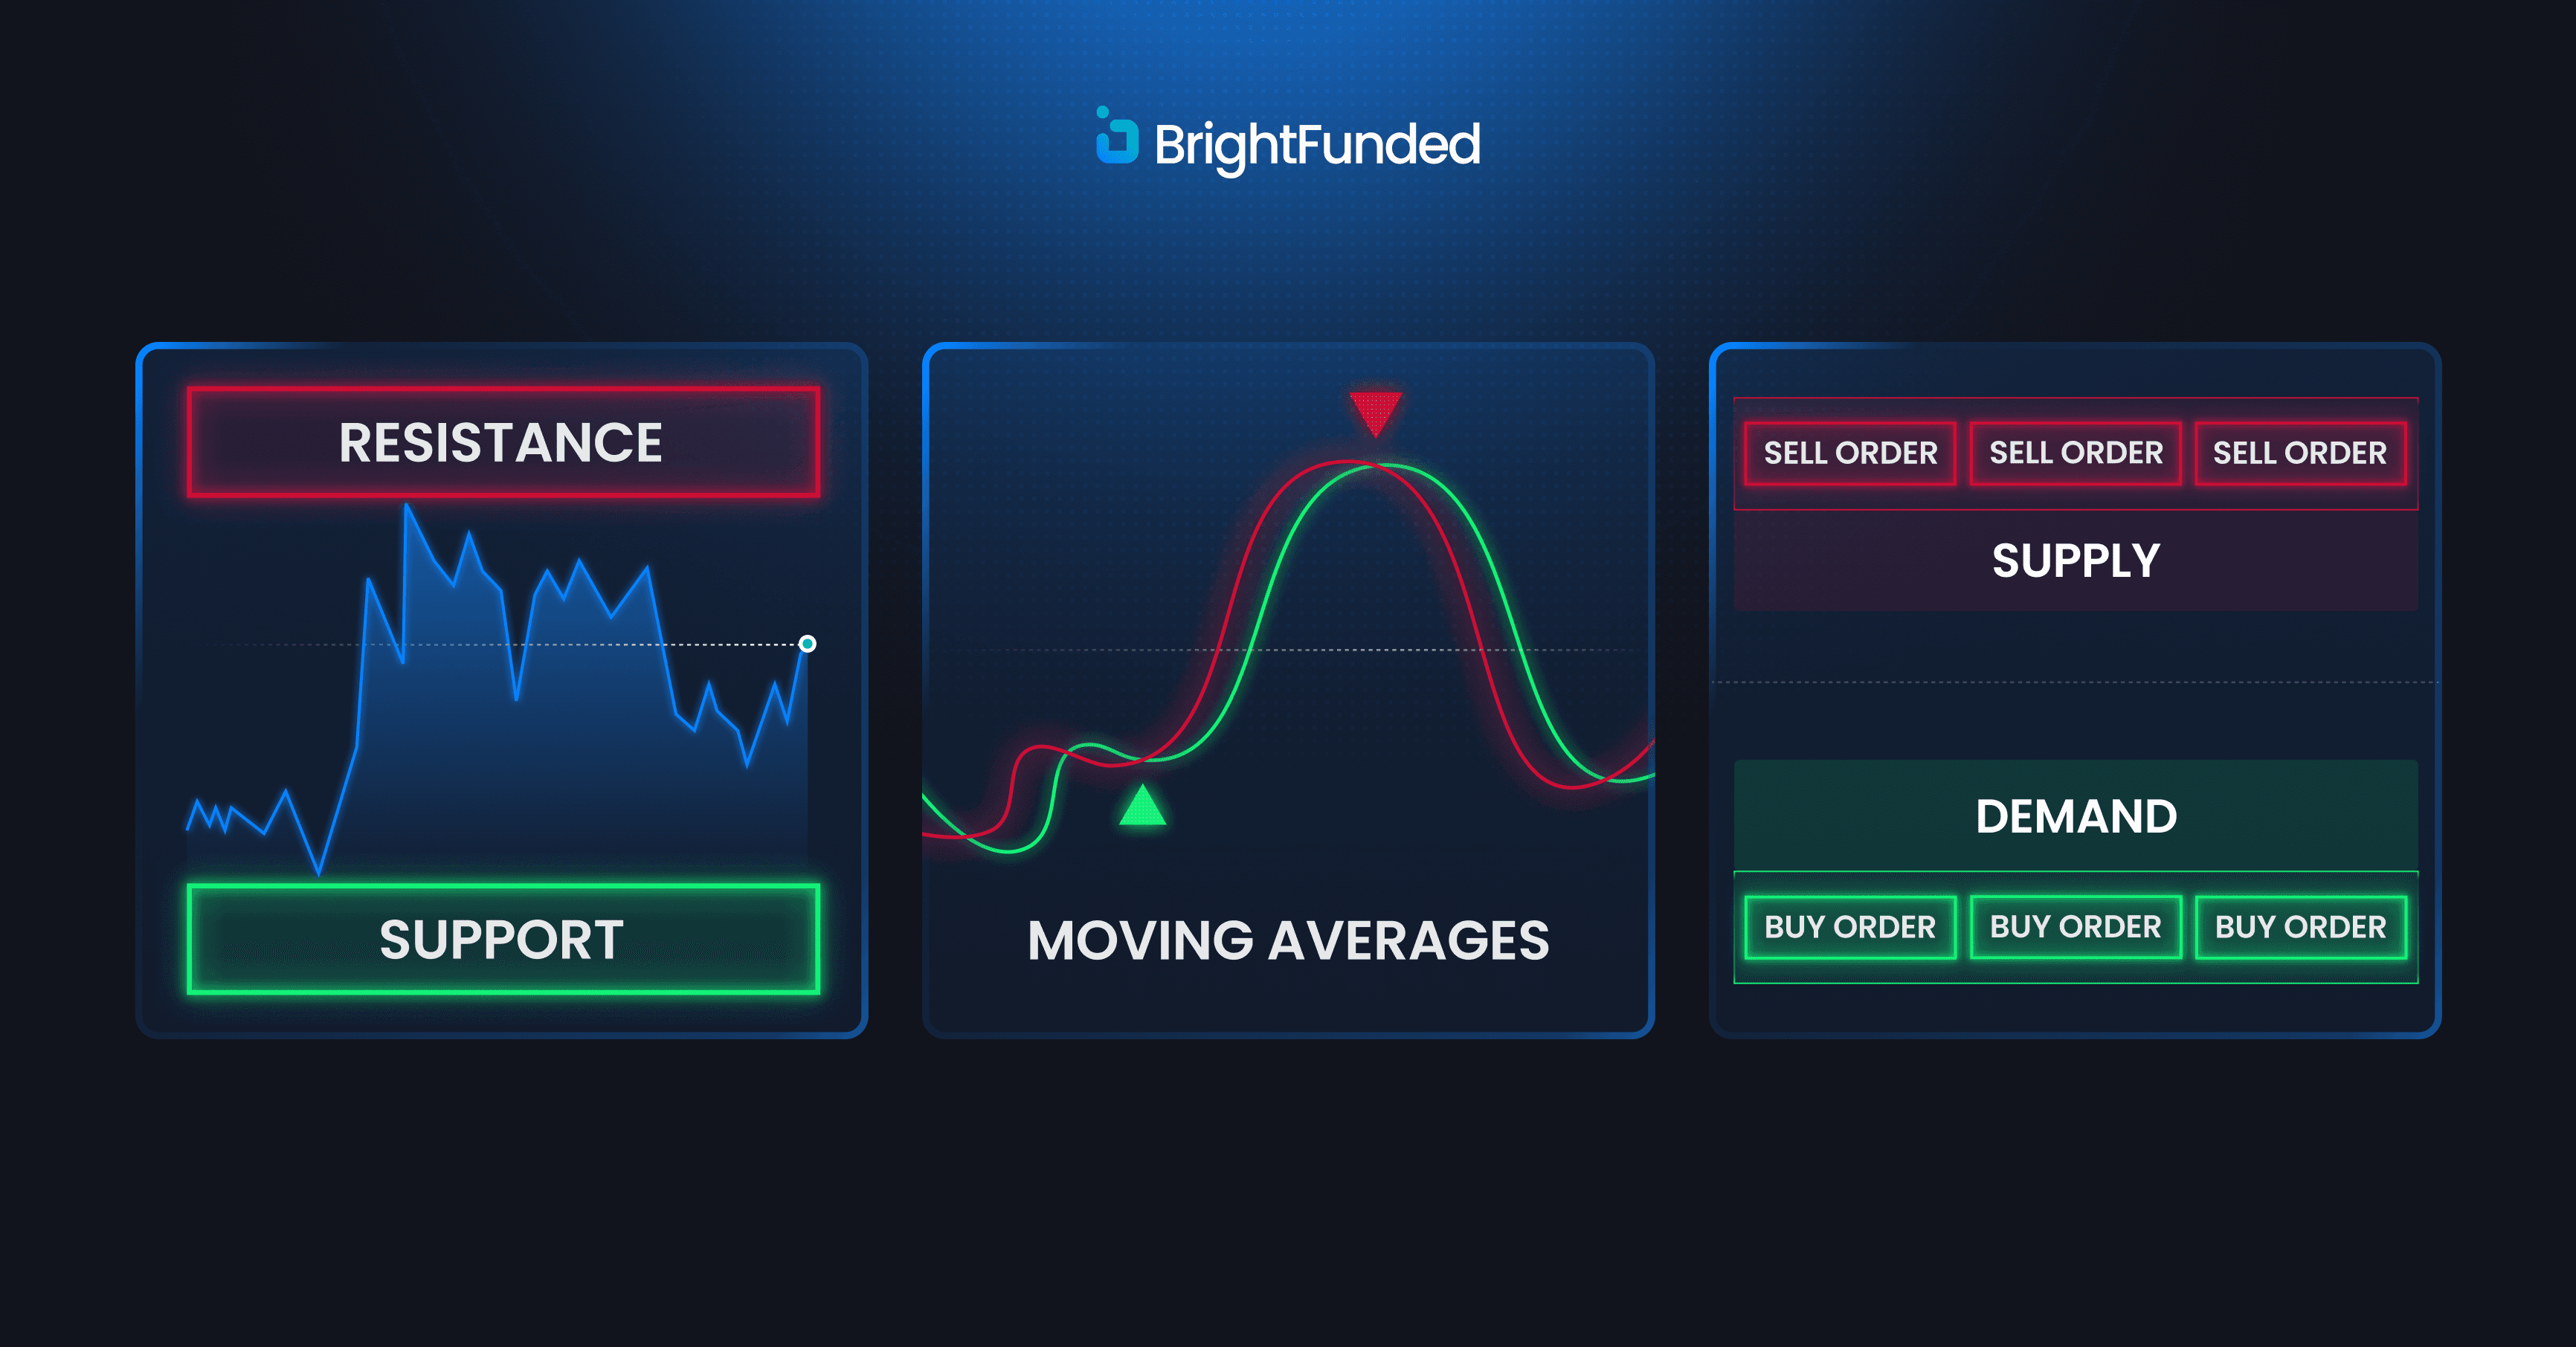
Key Trading Zones in Price Action Analysis

A crucial part of price action analysis is identifying areas of value, where trades have the highest probability of success. These areas represent price levels where significant market activity occurs, increasing the likelihood of strong reactions when the price reaches them. Understanding these zones allows traders to make informed decisions, improving trade accuracy and risk management.
Below are the three key areas of value that traders should focus on:
1. Support and Resistance Levels
Support and resistance are foundational concepts in trading and are used extensively in high-probability trading strategies.
- Support: A price level where buying pressure is strong enough to prevent further declines. Buyers step in at these levels, increasing demand and pushing prices higher.
- Resistance: A price level where selling pressure is strong enough to prevent further gains. Sellers begin to take profits or enter new positions, increasing supply and pushing prices lower.
How to Identify Support and Resistance:
- Look for multiple price rejections at the same level over time.
- Identify round numbers or psychological levels (e.g., 1.3000 in forex, $100 in stocks).
- Observe previous swing highs and lows, as price often reacts at these levels.
Why Support and Resistance Matter:
- Traders use them to time entries and exits with better precision.
- When price approaches support, it presents a potential buying opportunity.
- When price approaches resistance, it offers a potential selling opportunity.
- Breakouts above resistance or below support often indicate a trend continuation.
Example of Trading Support & Resistance:
If price approaches a well-established support level but fails to break below it multiple times, traders may look for bullish confirmation (such as a candlestick reversal pattern) to enter a long position. Conversely, if the price tests resistance and gets rejected, it can be a signal for a short trade.
2. Dynamic Support & Resistance (Moving Averages)
While horizontal support and resistance levels remain static, moving averages act as dynamic areas of value that adjust as price moves.
- The 50 EMA (Exponential Moving Average) and 200 EMA are widely used by traders to gauge the overall trend.
- In strong uptrends, prices often bounce off the 50 EMA, providing buy opportunities on pullbacks.
- In downtrends, prices frequently reject the 50 EMA, making it an area of value for short trades.
- The 200 EMA is considered a long-term trend indicator—when price trades above it, the market is generally bullish, and when price trades below it, the market is bearish.
Why Dynamic Support & Resistance is Important:
- They adjust in real time, helping traders react to changing market conditions.
- They filter false signals by providing an additional confirmation layer.
- Institutional traders often use moving averages, increasing their significance.
Example of Trading with Moving Averages:
A trader may wait for price to pull back to the 50 EMA in an uptrend before entering a long trade. If price bounces off the moving average with strong bullish candles, it confirms that buyers are defending the level. Similarly, if price fails to break above the 50 EMA in a downtrend, it signals potential continuation of the bearish move.
3. Liquidity Zones
Liquidity zones are key price areas where a large number of buy or sell orders are clustered. These zones often lead to sharp price movements due to the activation of stop-loss orders and large institutional trades.
Where Liquidity Zones Exist:
- Near support and resistance levels, where traders place stop-loss orders.
- At round numbers (e.g., 1.5000 in forex, $50 in stocks), where large traders execute orders.
- At previous breakout or breakdown points, where price previously made strong moves.
Why Liquidity Zones Matter:
- These areas act as magnets, pulling price toward them.
- When price reaches a liquidity zone, it often experiences a sharp rejection or acceleration, depending on whether the orders are absorbed or overwhelmed.
- They create high-probability trading opportunities by offering low-risk, high-reward setups.
Example of Trading Liquidity Zones:
Imagine price is approaching a well-established support level, where many traders have placed stop-loss orders just below it. If price breaks through the level, it could trigger a stop hunt, leading to a sharp downward move before reversing higher as institutional traders step in to buy at lower prices. Smart traders anticipate liquidity grabs and look for reversals or breakouts at these zones.
Bringing It All Together: Finding High-Probability Trading Opportunities
By recognizing and combining these key areas of value, traders can develop a more refined price action analysis approach. Instead of randomly entering trades, they can wait for price to reach significant levels where market participants are likely to take action.
For high-probability trading, a structured approach might look like this:
1. Identify whether the market is trending or ranging.
2. Look for support and resistance levels to find areas where price has historically reacted.
3. Observe whether price is near a dynamic support/resistance level like the 50 EMA or 200 EMA.
4. Determine whether liquidity zones exist nearby, as these can cause strong price reactions.
5. Wait for price action confirmation (candlestick patterns, momentum shifts) before entering a trade.
Using this method, traders improve their ability to spot high-probability trading setups while managing risk effectively. Instead of chasing price, they wait for the price to come to them, increasing the likelihood of successful trades.
Best Trade Entry Techniques for High-Probability Trading
1. Trading Pullbacks
A pullback is a temporary price movement against the trend, providing traders with an opportunity to enter the market at a better price.
How to trade pullbacks:
- Identify a trend using a moving average (e.g., 50 EMA).
- Wait for a retracement to support or resistance.
- Look for a reversal candlestick pattern (e.g., pin bar, engulfing candle) before entering.
2. Breakout Trading
A breakout occurs when price moves beyond a key support or resistance level with strong momentum.
How to trade breakouts:
- Identify consolidation areas or chart patterns (triangles, flags, etc.).
- Enter when price closes above resistance (for long trades) or below support (for short trades).
- Confirm with increasing volume to avoid false breakouts.
3. Failure Test (Fakeout) Strategy
This strategy capitalizes on false breakouts where price briefly moves beyond a key level before reversing.
How to trade failure tests:
- Identify key support/resistance levels.
- Wait for price to break beyond the level but fail to hold.
- Enter in the opposite direction once the price returns inside the range.
Each of these strategies aligns with high-probability trading, increasing your odds of executing successful trades.
To succeed in high-probability trading, proper risk management is essential. Even the most well-planned trade setups can fail due to unexpected market movements, so having a well-placed stop-loss ensures that traders limit their downside risk while still allowing the trade enough room to develop.
A stop-loss acts as a predefined exit point, helping traders prevent emotional decision-making and protecting their capital. Below are three highly effective stop-loss techniques that can be used in price action analysis to improve trade outcomes.
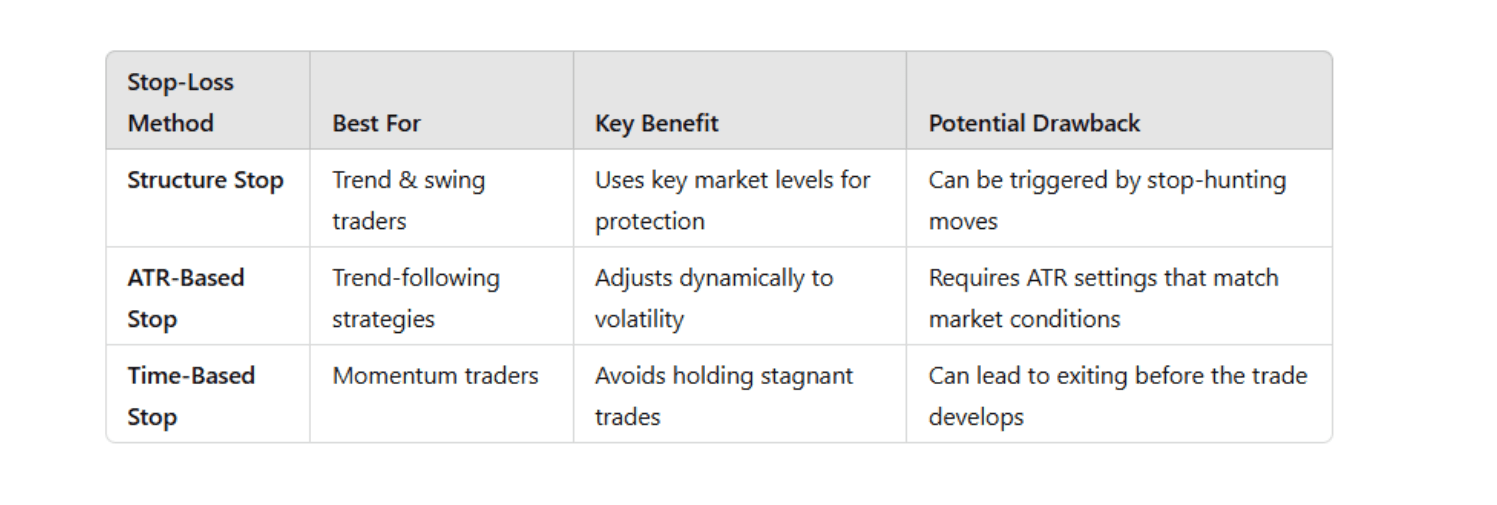
Effective Stop-Loss Strategies for High-Probability Trading
1. Structure Stop: Placing Stops at Key Market Levels
Structure stops are one of the most logical ways to place a stop-loss, as they rely on existing support and resistance levels. These key price zones indicate where buying or selling pressure has been strong in the past, making them natural areas for price to react.
- For Long Trades: Place the stop-loss below a strong support level or a recent swing low.
- For Short Trades: Place the stop-loss above a resistance level or a recent swing high.
Why Structure Stops Work:
- They are based on market logic, ensuring that the trade is only stopped out if price truly breaks a key level.
- They help avoid random stop-outs, as they are placed beyond areas where price is likely to bounce.
- They allow traders to have a clear invalidation point—if price breaches a strong level, the setup is no longer valid.
Example of Using a Structure Stop:
Imagine you enter a long trade at a key support level where price has bounced multiple times. Instead of placing a random stop-loss, you position it slightly below the lowest swing low. This way, if price reverses and breaks that support, you exit before larger losses occur.
For short trades, the same concept applies—placing the stop just above a resistance level ensures the trade stays active unless the market proves otherwise.
2. ATR-Based Stop (Volatility Stop): Adjusting for Market Conditions
The Average True Range (ATR) is a powerful tool for setting stop-losses based on market volatility. Since price movements vary depending on volatility conditions, setting fixed stop-loss distances can sometimes be ineffective. Instead, traders can use ATR-based stops to adjust dynamically.
How to Set an ATR-Based Stop:
- Find the ATR value (usually using a 14-period ATR).
- Multiply it by a factor such as 2 or 3 to determine a reasonable stop distance.
- For long trades, place the stop ATR value below the entry price.
- For short trades, place the stop ATR value above the entry price.
Why ATR-Based Stops Work:
- They adjust to market conditions—during volatile periods, the stop is wider; in calm markets, it is closer.
- They reduce premature stop-outs, as they account for natural price fluctuations.
- They are useful for trend-following strategies, ensuring the stop allows the trend to develop before being exited.
Example of Using an ATR-Based Stop:
If the ATR value for an asset is 50 pips, a trader might set their stop-loss 2x ATR (100 pips) away from the entry point. This ensures that normal market fluctuations don’t trigger an early exit while still keeping risk in check.
ATR-based stops are especially useful when trading breakouts, where price can be highly volatile but still maintain its trend direction.
3. Time-Based Stop: Exiting Stagnant Trades
A time-based stop is an effective approach for traders who want to avoid being stuck in non-moving trades. This method involves exiting a trade after a certain period if price has not moved in the expected direction.
How to Use a Time-Based Stop:
- Define a timeframe in which the trade should show progress.
- If price remains unchanged beyond this period, exit the trade.
- This method works well for momentum traders who need price to move quickly.
Why Time-Based Stops Work:
- They help free up capital from trades that aren’t working.
- They prevent traders from holding dead trades that tie up margin and miss better opportunities.
- They enhance efficiency, ensuring traders focus only on active, high-probability setups.
Example of Using a Time-Based Stop:
A trader enters a breakout trade, expecting price to move within a few hours or days. If price remains range-bound without breaking out, they exit the trade - even if it hasn’t hit the stop-loss—freeing capital for better opportunities.
This type of stop is commonly used in intraday trading or news-based strategies, where price movement should be immediate.
Choosing the Right Stop-Loss Strategy for High-Probability Trading
Each of these stop-loss methods has its strengths, and choosing the right one depends on your trading style and the market conditions:
Protecting Capital While Maximizing Profits
Setting stop-losses correctly is a crucial part of high-probability trading, ensuring that traders:
✔️ Minimize risk while still allowing trades room to develop.
✔️ Avoid emotional exits by sticking to a structured risk management plan.
✔️ Protect profits while maintaining long-term consistency.
No matter which stop-loss strategy you choose, the goal is the same - to manage risk effectively and maximize your chances of long-term profitability. By applying structure stops, ATR-based stops, or time-based stops, traders can improve their price action analysis and enhance overall performance.
A High-Probability Trading Strategy for All Market Conditions
This simple high-probability trading strategy helps traders profit in both bullish and bearish markets.
Trading Rules:
1. Identify the Trend – Use the 50 EMA; price above it indicates an uptrend, below it indicates a downtrend.
2. Wait for a Pullback – Enter at a support level in an uptrend or resistance in a downtrend.
3. Confirm the Setup – Look for candlestick patterns like pin bars or engulfing candles.
4. Enter the Trade – Buy (long) when price shows bullish confirmation; sell (short) when price shows bearish confirmation.
5. Place Stop-Loss – Below support for long trades, above resistance for short trades.
6.Take Profit at Swing Highs/Lows – Target recent highs/lows as profit-taking areas.
This approach aligns with price action analysis, making it an effective strategy for high-probability trading.
Why Funded Trading is the Best Way to Scale Your Trading Career
Trading successfully requires capital, and that’s where funded trading programs like Bright Funded come in. With Bright Funded, traders can access up to $400,000 in trading capital, benefit from lightning-fast payouts, and earn a profit split of up to 100%.
Instead of risking your personal funds, you can trade with a prop firm account, allowing you to focus purely on executing high-probability trading strategies without financial stress.
Final Thoughts on Price Action Analysis and High-Probability Trading
Mastering price action analysis allows traders to eliminate unnecessary indicators and focus on real market movement. The key takeaways from this guide include:
- Always trade with the trend for high-probability trading setups.
- Identify key support, resistance, and liquidity zones to time entries better.
- Use pullbacks, breakouts, and failure tests for precise trade execution.
- Apply smart stop-loss strategies to minimize risk.
- Consider trading with a prop firm like Bright Funded to maximize your trading potential.
By applying these principles, traders can develop consistent, profitable trading habits.
Start implementing high-probability trading techniques today and refine your skills in price action analysis for long-term success!