01.03.2025
This information is crucial for prop traders who need to understand market dynamics and liquidity conditions to optimize their strategies. As proprietary trading firms seek to gain an edge in increasingly competitive markets, the integration of volume profile heatmaps into their analytical toolkit has become a game-changer.
Key Takeaways
- Volume Profile Heatmaps are a valuable tool in prop trading for analyzing market liquidity and making informed trading decisions.
- Market liquidity zones play a crucial role in prop trading, as they indicate areas of high trading activity and potential price movements.
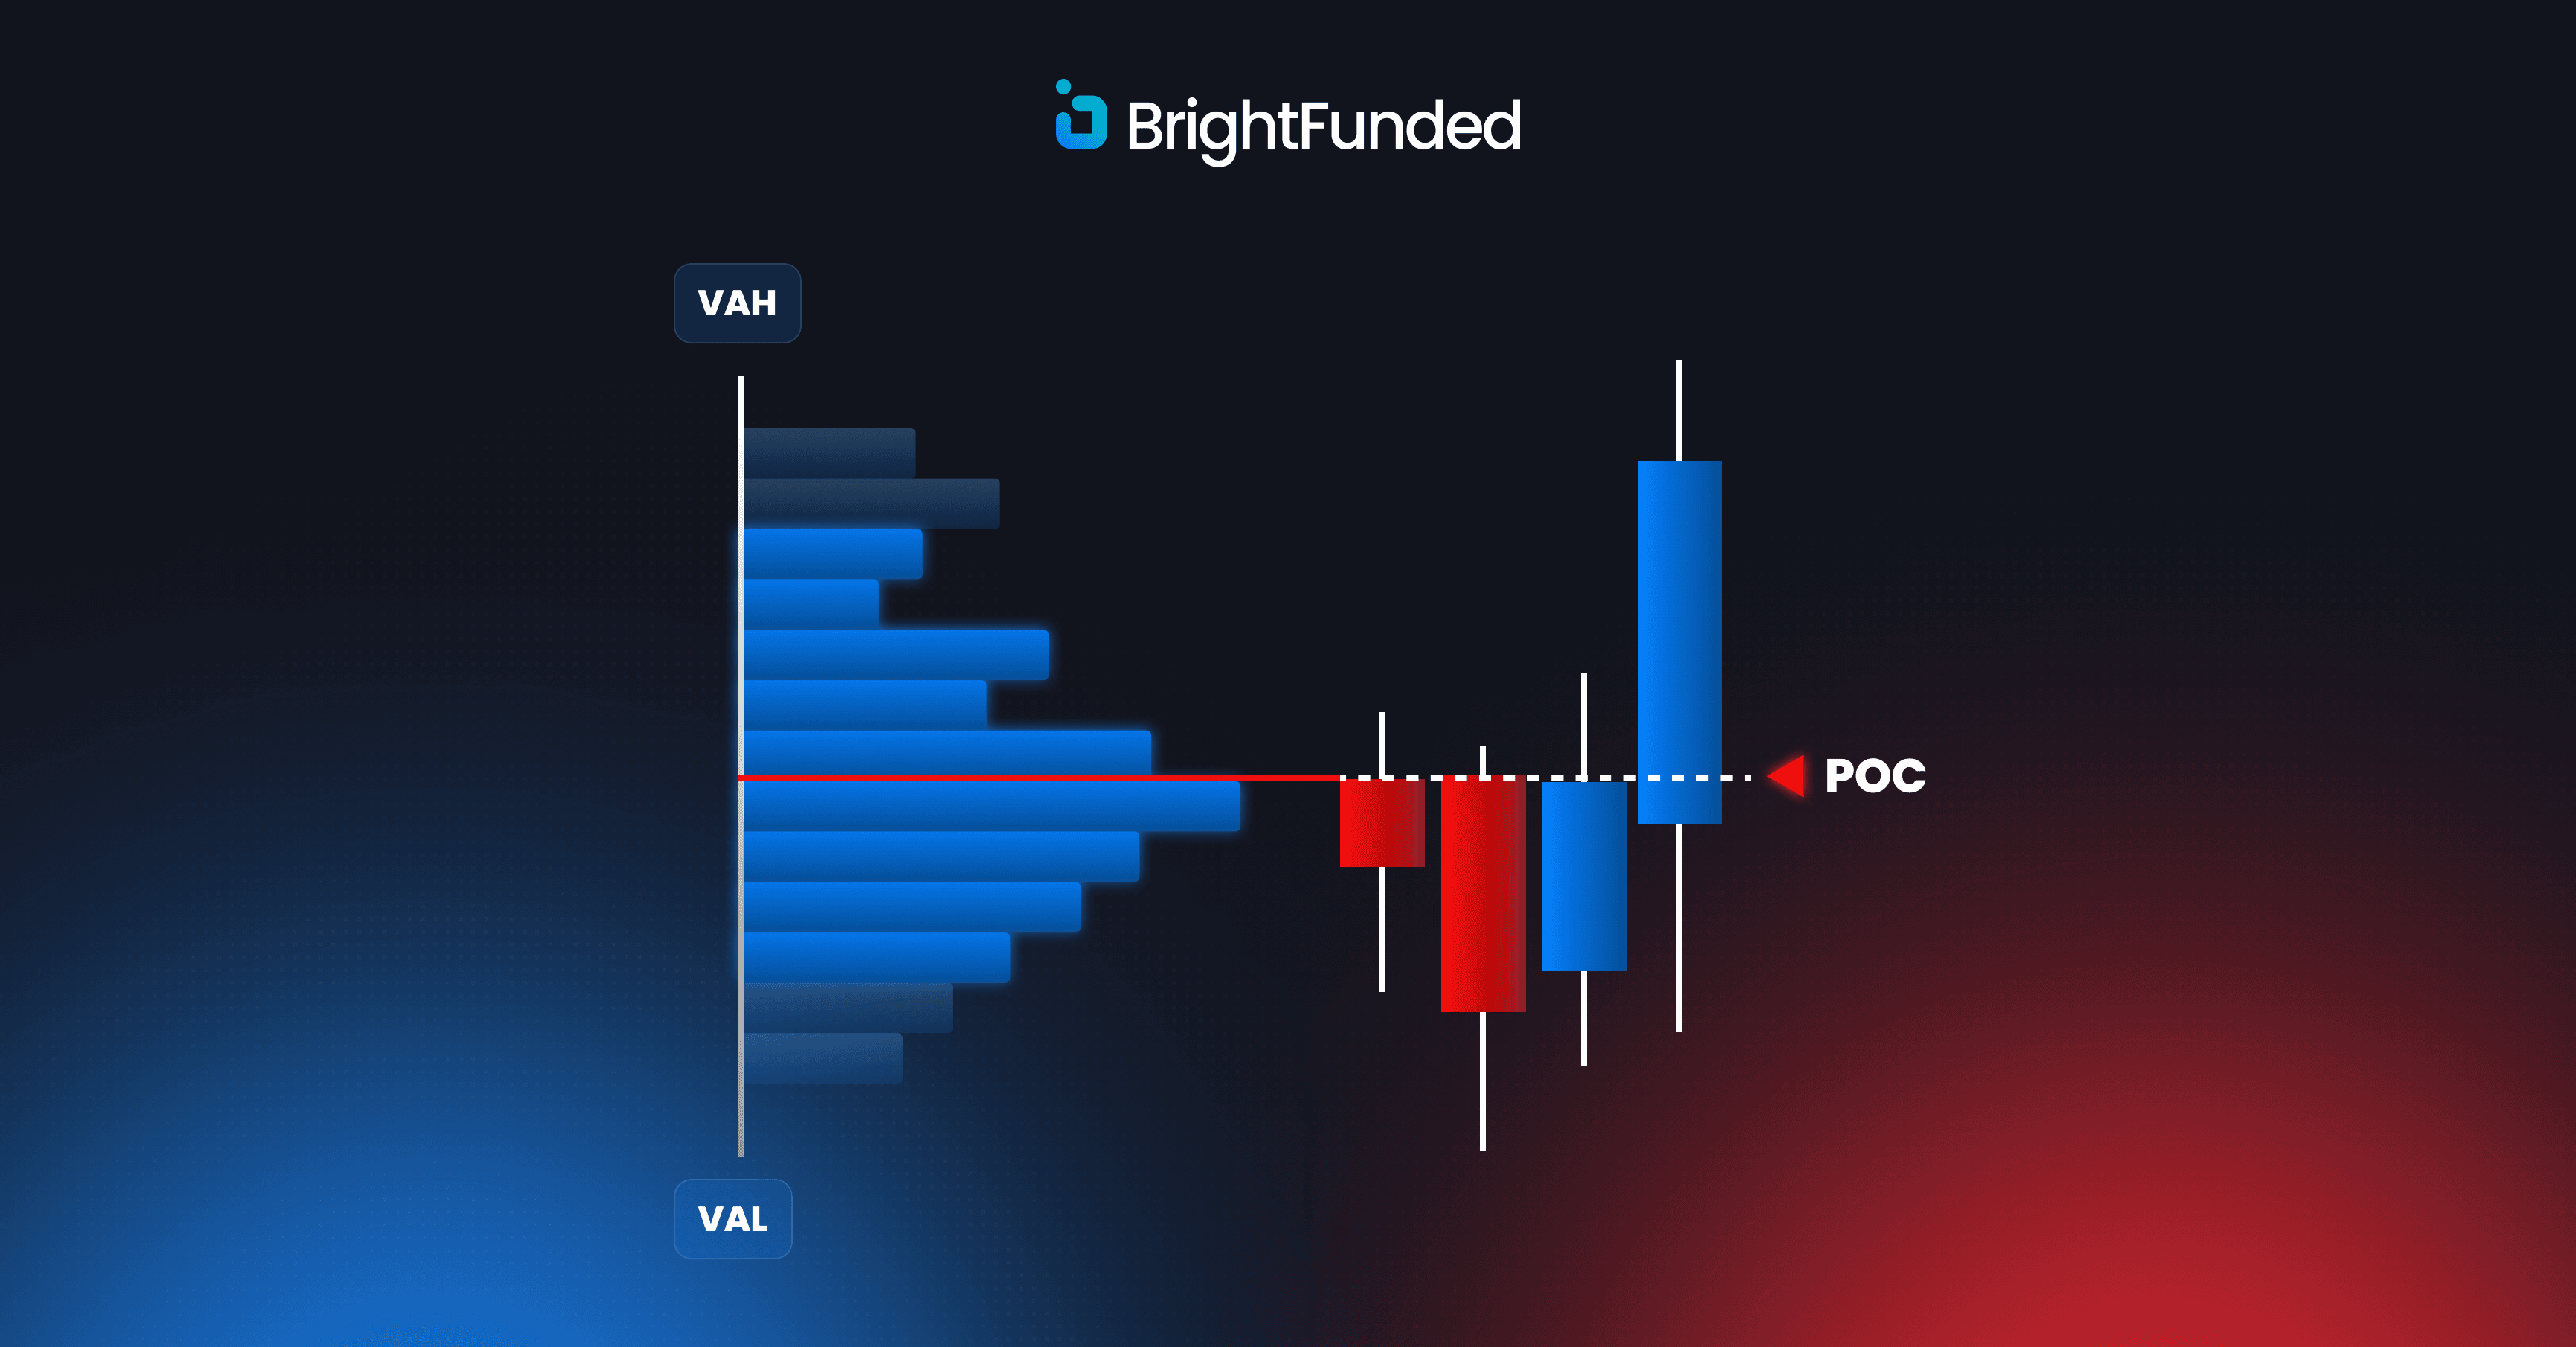
- Volume Profile Heatmaps help traders identify market liquidity zones by visualizing the volume traded at each price level.
- Prop trading firms can effectively utilize Volume Profile Heatmaps to identify key support and resistance levels and optimize their trading strategies.
- Market liquidity zones are essential in prop trading strategies, as they provide valuable insights into market dynamics and potential trading opportunities.
Understanding Market Liquidity Zones and Their Importance
Insights into Trading Decisions
Understanding market liquidity zones is essential in prop trading as they provide insights into potential entry and exit points for trades. By identifying these zones, traders can anticipate how the market might react when prices approach these levels, allowing for more informed trading decisions.
Market Sentiment Indicators
Liquidity zones can serve as critical indicators of market sentiment. For instance, if a liquidity zone is consistently tested but not breached, it may indicate strong support or resistance, reflecting the collective behavior of market participants. Prop traders can leverage this information to align their strategies with prevailing market trends.
Avoiding Adverse Trading Conditions
Recognizing liquidity zones can also help traders avoid entering positions during periods of low liquidity, which can lead to slippage and unfavorable trade executions. Thus, a comprehensive understanding of market liquidity zones is integral to developing robust trading strategies in proprietary trading environments.
How Volume Profile Heatmaps Can Help Identify Market Liquidity Zones
Volume profile heatmaps excel at pinpointing market liquidity zones by visually representing where significant trading activity has occurred at various price levels. By analyzing these heatmaps, traders can quickly identify areas of high volume that correspond to potential support and resistance levels. For example, if a volume profile heatmap shows a pronounced peak at a specific price level, it indicates that many traders have engaged in transactions at that price, suggesting that it may act as a strong support or resistance zone in the future.
Furthermore, volume profile heatmaps allow traders to assess the strength of these liquidity zones. A zone characterized by a dense cluster of volume indicates strong interest from market participants, while a more diffuse volume distribution may suggest weaker support or resistance. This differentiation is crucial for prop traders who need to gauge the likelihood of price reversals or breakouts.
By utilizing volume profile heatmaps, traders can make more informed decisions about when to enter or exit positions based on the underlying market structure and liquidity dynamics.
Utilizing Volume Profile Heatmaps in a Prop Trading Firm
In a proprietary trading firm, the application of volume profile heatmaps can significantly enhance the overall trading strategy. Traders can incorporate these heatmaps into their daily routines by analyzing them alongside other technical indicators and market data. For instance, when preparing for the trading day, a trader might review the previous day's volume profile heatmap to identify key liquidity zones that could influence their trading decisions.
This proactive approach allows traders to enter the market with a clear understanding of potential price levels to watch. Moreover, volume profile heatmaps can facilitate collaboration among traders within a prop trading firm. By sharing insights derived from these heatmaps, team members can develop a collective understanding of market conditions and refine their strategies accordingly.
For example, if multiple traders identify the same liquidity zone as significant based on their analysis of volume profile heatmaps, it may reinforce the validity of that zone and encourage coordinated trading efforts. This collaborative environment fosters a culture of continuous learning and adaptation, which is essential for success in the fast-paced world of proprietary trading.
The Role of Market Liquidity Zones in Prop Trading Strategies
Market liquidity zones play a pivotal role in shaping prop trading strategies by providing critical information about potential price movements and market behavior. Traders often design their strategies around these zones to maximize their chances of success. For instance, a common strategy involves buying near established support zones and selling near resistance zones identified through volume profile analysis.
This approach allows traders to capitalize on price reversals while minimizing risk exposure. Additionally, understanding liquidity zones can inform risk management practices within prop trading firms. By recognizing where significant buying or selling pressure exists, traders can set stop-loss orders more effectively and determine optimal position sizes based on the likelihood of price fluctuations around these zones.
This strategic alignment with market dynamics not only enhances profitability but also contributes to more disciplined trading practices. As such, integrating market liquidity zones into prop trading strategies is essential for navigating complex market environments.
Case Studies: Successful Implementation of Volume Profile Heatmaps
Enhancing Entry and Exit Strategies
One notable case involves a firm that specializes in futures trading. By employing volume profile heatmaps to identify key liquidity zones in the futures markets, the firm was able to enhance its entry and exit strategies significantly. Traders utilized these heatmaps to pinpoint areas where large volumes had previously traded, allowing them to anticipate potential reversals or breakouts with greater accuracy.
Improving Decision-Making Processes
Another example comes from a prop trading firm focused on equities. The firm implemented volume profile analysis as part of its daily routine, leading to improved decision-making processes among its traders. By consistently monitoring volume profile heatmaps for various stocks, traders were able to identify high-probability setups based on established liquidity zones.
Tangible Improvements in Trading Performance
This approach not only increased their win rates but also fostered a culture of data-driven decision-making within the firm. These case studies illustrate how the effective use of volume profile heatmaps can lead to tangible improvements in trading performance.
Challenges and Limitations of Using Volume Profile Heatmaps
Despite their advantages, there are challenges and limitations associated with using volume profile heatmaps in prop trading. One significant challenge is the potential for misinterpretation of the data presented in these heatmaps. Traders may mistakenly assume that high-volume areas will always act as strong support or resistance levels without considering other market factors that could influence price movements.
This overreliance on volume profile analysis can lead to poor decision-making and increased risk exposure. Additionally, volume profile heatmaps are inherently historical tools; they reflect past trading activity rather than predicting future price movements with certainty. Market conditions can change rapidly due to various factors such as economic news releases or geopolitical events, rendering previously identified liquidity zones less relevant.
Traders must remain vigilant and adaptable, continuously reassessing their strategies based on real-time market developments rather than solely relying on historical data from volume profile heatmaps.
The Future of Market Liquidity Zone Analysis
As proprietary trading continues to evolve in response to technological advancements and changing market dynamics, the role of market liquidity zone analysis will likely become even more prominent. The integration of sophisticated analytical tools like volume profile heatmaps will enable traders to gain deeper insights into market behavior and enhance their decision-making processes. As firms increasingly prioritize data-driven strategies, those that effectively leverage volume profile analysis will be better positioned to navigate complex market environments.
Looking ahead, advancements in machine learning and artificial intelligence may further enhance the capabilities of volume profile heatmap analysis. By incorporating predictive analytics into this framework, prop trading firms could potentially identify emerging liquidity zones before they become apparent through traditional analysis methods. This evolution would not only improve trading performance but also contribute to more efficient market functioning overall.
As proprietary trading firms continue to adapt and innovate, the future of market liquidity zone analysis promises exciting possibilities for enhancing trading strategies and achieving sustained success in competitive markets.