28.02.2025
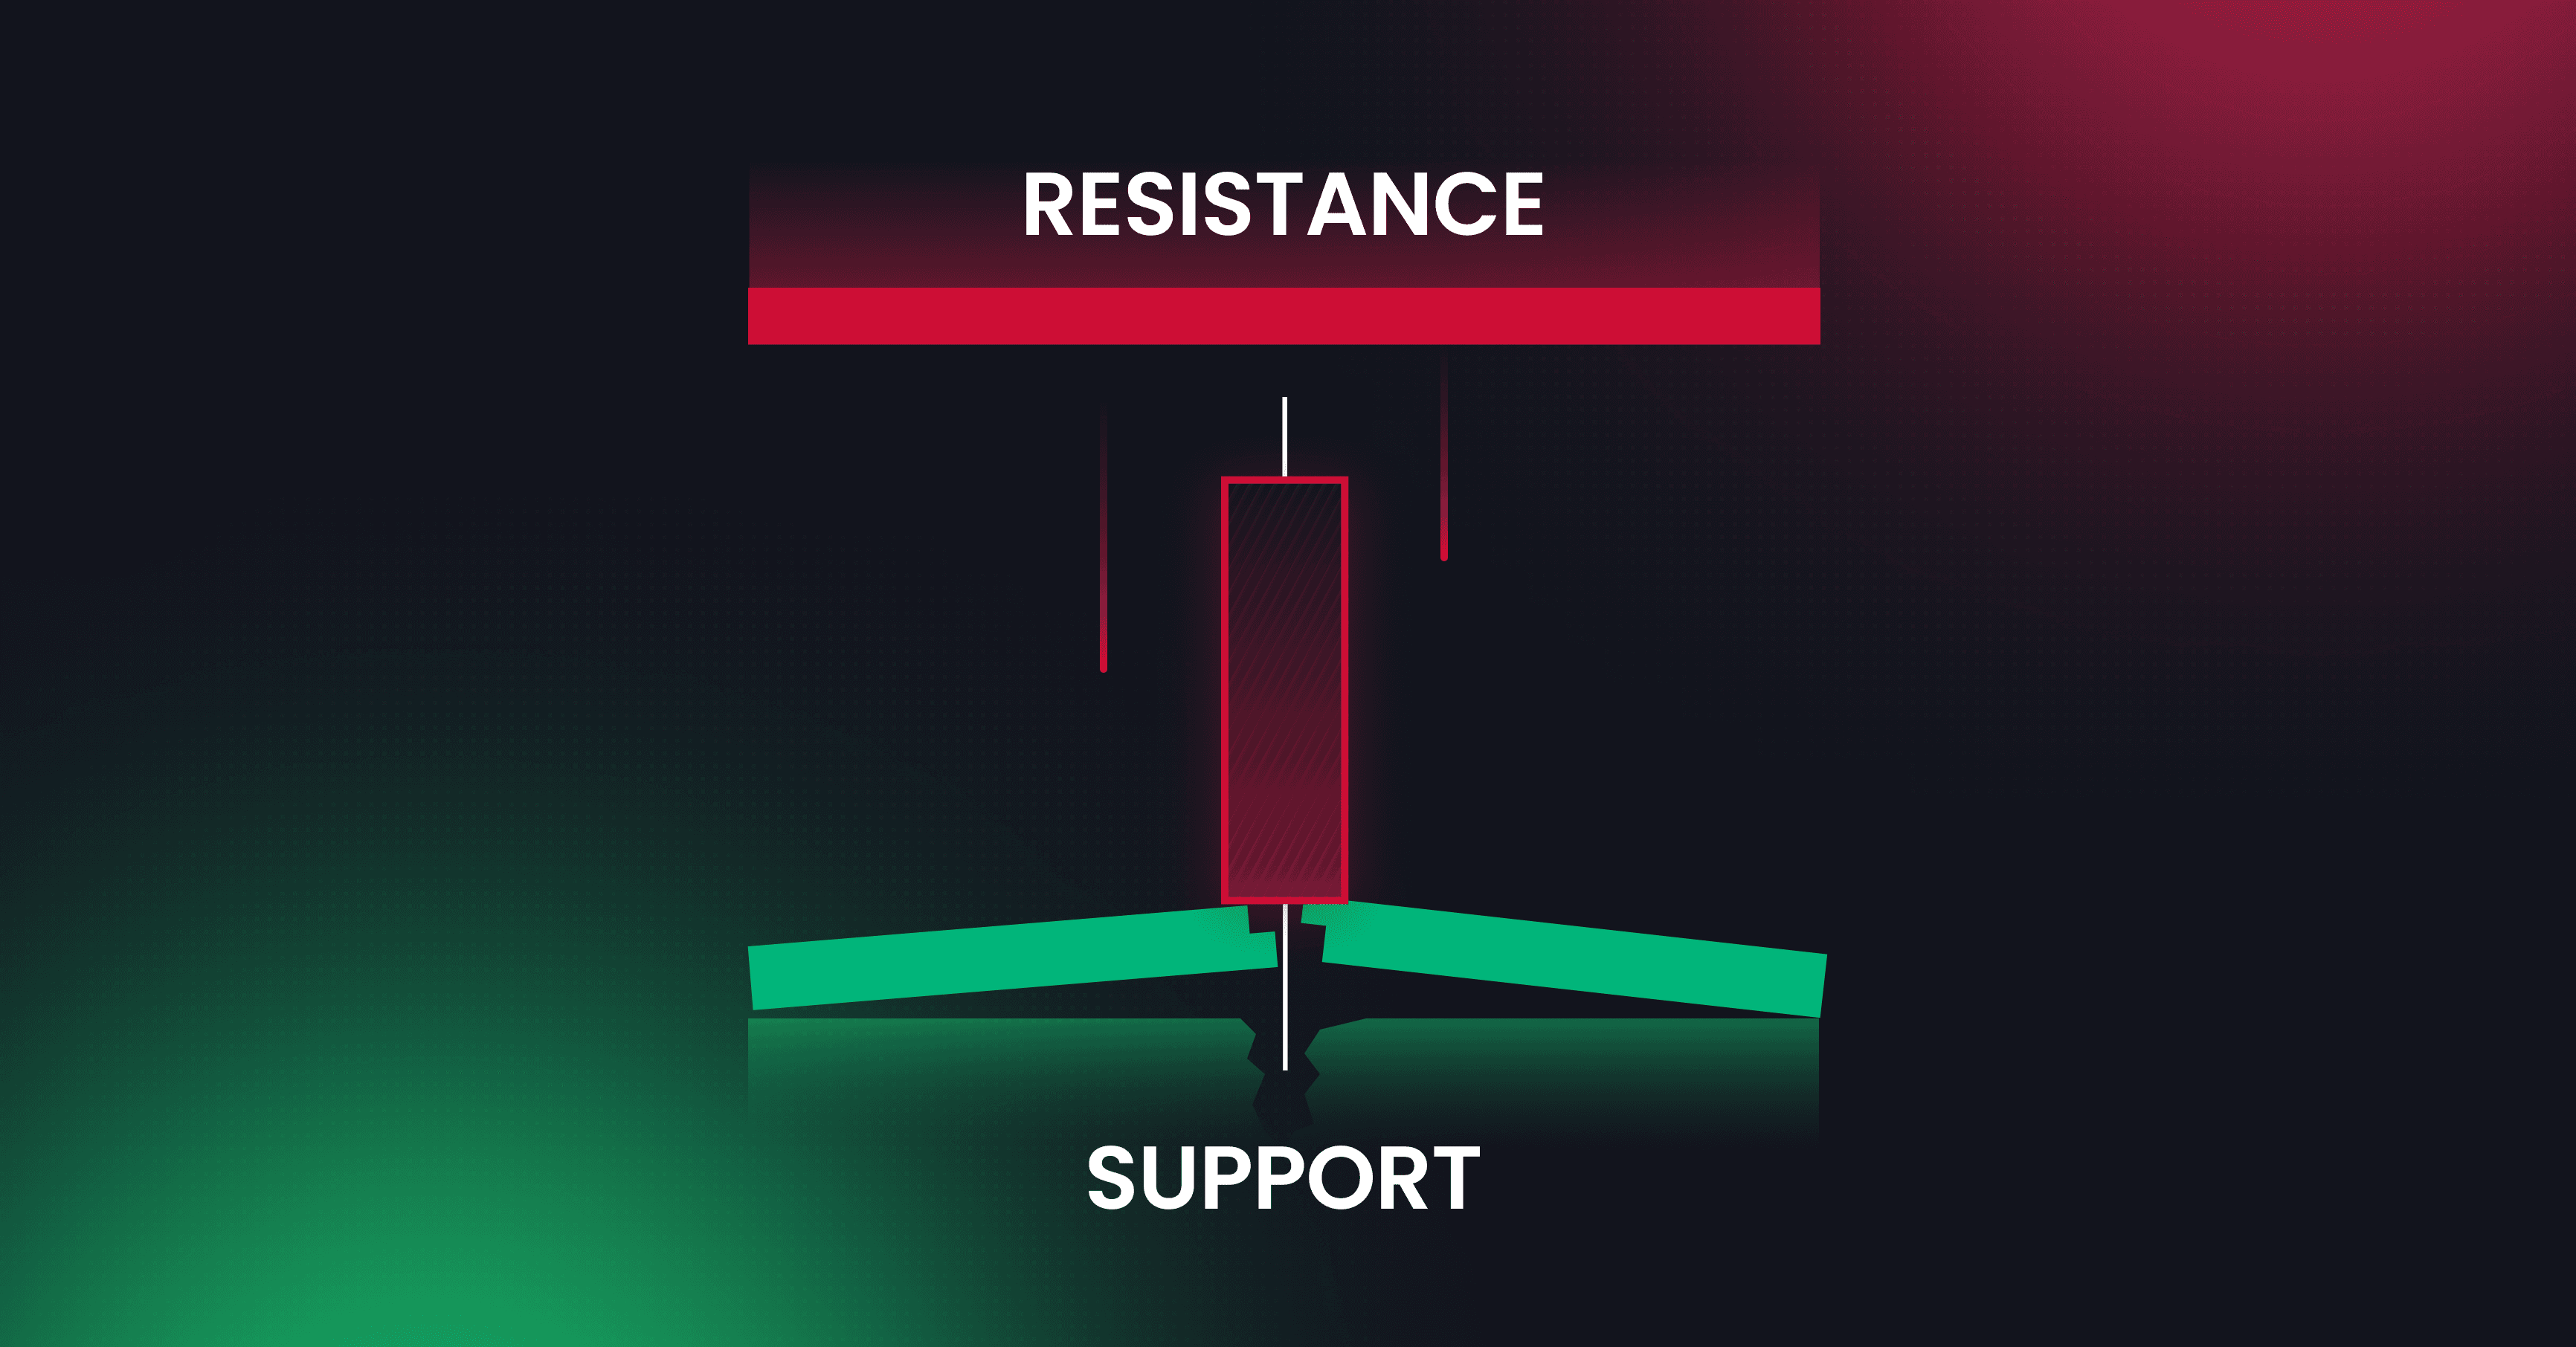
In the world of trading, the concepts of support and resistance are fundamental to your success. Support refers to a price level where a stock or asset tends to stop falling and may even bounce back up. It acts as a safety net, providing a cushion for traders who believe that the price will not drop below this level.
Conversely, resistance is the opposite; it is a price point where an asset struggles to rise above, often leading to a reversal or a pullback. Understanding these levels is crucial for making informed trading decisions, as they can indicate potential entry and exit points. As you delve deeper into trading, you will find that support and resistance levels are not merely static lines on a chart.
They are dynamic and can change based on market conditions, trader sentiment, and various economic factors. Recognizing these levels can help you anticipate price movements and make strategic decisions. By understanding the psychology behind these levels, you can better position yourself in the market, whether you are looking to buy low at support or sell high at resistance.
Identifying Key Support and Resistance Levels
Identifying key support and resistance levels requires a combination of technical analysis and market observation. One effective method is to look at historical price data. By examining past price movements, you can pinpoint areas where the asset has repeatedly bounced off or struggled to break through.
These historical levels often serve as strong indicators of future price behavior. You might find that certain price points have acted as support or resistance multiple times, reinforcing their significance in the eyes of traders. Another approach is to utilize technical indicators such as moving averages, Fibonacci retracements, or trend lines.
Moving averages can smooth out price fluctuations and highlight potential support or resistance zones. Fibonacci retracements, on the other hand, can help you identify potential reversal points based on the mathematical relationships between numbers. By combining these tools with your observations of historical price action, you can create a more comprehensive picture of where key support and resistance levels lie.
Utilizing Support and Resistance in Prop Trading
In proprietary trading, where firms trade their own capital rather than clients' funds, understanding support and resistance becomes even more critical. As a proprietary trader, you are often under pressure to make quick decisions that can significantly impact your firm's bottom line. By effectively utilizing support and resistance levels, you can enhance your trading strategy and improve your chances of success.
For instance, entering a trade near a strong support level can provide a favorable risk-to-reward ratio, allowing you to set tighter stop-loss orders while maximizing potential gains. Moreover, in prop trading, you may also need to consider the broader market context when applying support and resistance levels. Market sentiment can shift rapidly, affecting how these levels behave.
For example, if a major economic announcement is expected, it could lead to increased volatility that may cause traditional support and resistance levels to be breached. Being aware of these factors allows you to adapt your trading strategy accordingly, ensuring that you remain agile in a fast-paced environment.
The Role of Support and Resistance in Price Action Analysis
Price action analysis is a trading methodology that focuses on historical price movements rather than relying heavily on indicators or fundamental analysis. In this context, support and resistance play a pivotal role in your decision-making process. By observing how prices react at these levels, you can gain insights into market sentiment and potential future movements.
For instance, if an asset approaches a known resistance level and fails to break through, it may indicate that sellers are stepping in, leading to a potential downward movement. Additionally, price action analysis allows you to identify patterns that form around support and resistance levels. Candlestick patterns, for example, can provide valuable information about market sentiment at these critical junctures.
A bullish engulfing pattern at a support level may suggest that buyers are gaining strength, while a bearish engulfing pattern at resistance could signal that sellers are taking control. By honing your skills in price action analysis, you can make more informed trading decisions based on real-time market behavior.
The Psychology Behind Support and Resistance Levels
The psychology of traders plays a significant role in the formation of support and resistance levels. These levels are not just numbers; they represent collective beliefs about value among market participants. When many traders perceive a certain price point as significant—whether as a buying opportunity at support or a selling opportunity at resistance—this collective behavior reinforces the strength of these levels.
As you navigate the markets, understanding this psychological aspect can give you an edge in predicting how other traders might react. Moreover, the concept of self-fulfilling prophecies comes into play with support and resistance levels. When enough traders place buy orders at a support level or sell orders at a resistance level, their actions can create actual price movements that validate these levels further.
This phenomenon highlights the importance of not only recognizing these levels but also understanding the underlying psychology driving market behavior. By being aware of how other traders think and act around these levels, you can position yourself more strategically in your trades.
Managing Risk and Setting Targets Using Support and Resistance
Effective risk management is essential for any trader looking to achieve long-term success. Support and resistance levels provide valuable insights for setting stop-loss orders and profit targets. For instance, if you enter a long position near a strong support level, you might place your stop-loss just below this level to minimize potential losses if the trade goes against you.
This approach allows you to define your risk clearly while giving the trade room to breathe. On the flip side, when setting profit targets, resistance levels can serve as logical exit points for your trades. If you anticipate that an asset will struggle to break through a particular resistance level based on historical data or current market conditions, it makes sense to set your target just below this level.
This strategy not only helps you lock in profits but also reduces the risk of being caught in a reversal if the price fails to breach the resistance.